Stock Market Alerts & Trading Patterns Powered by AI

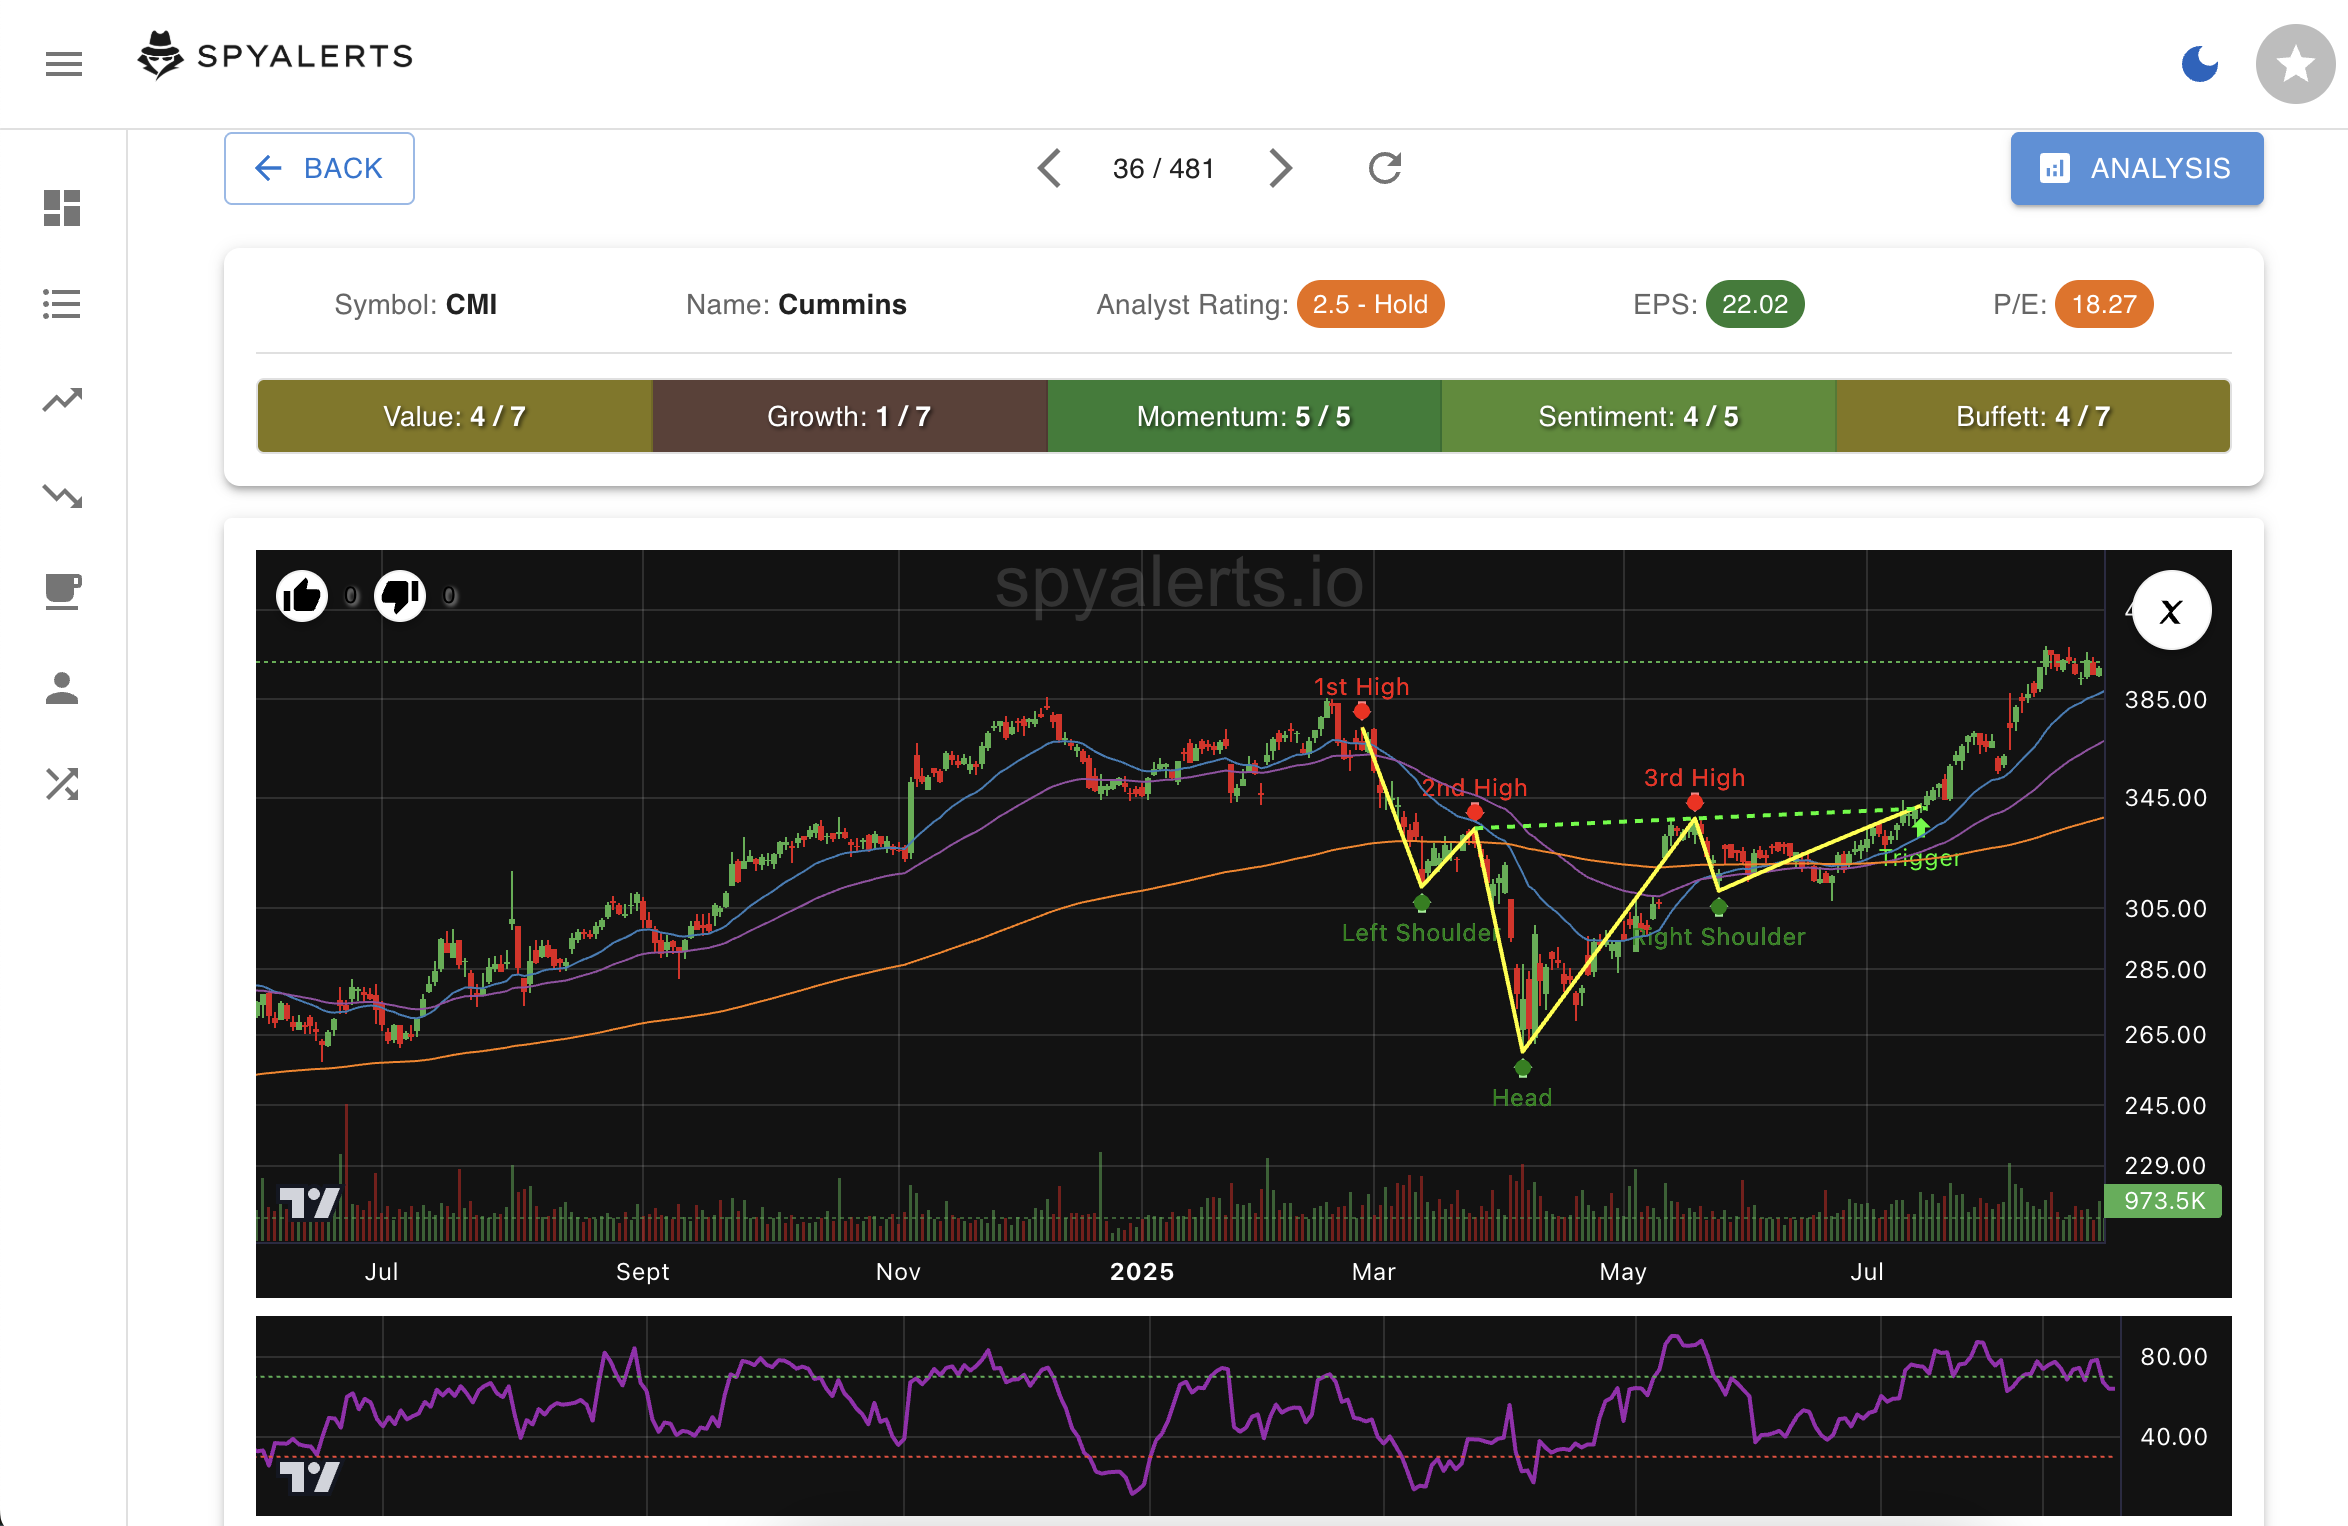
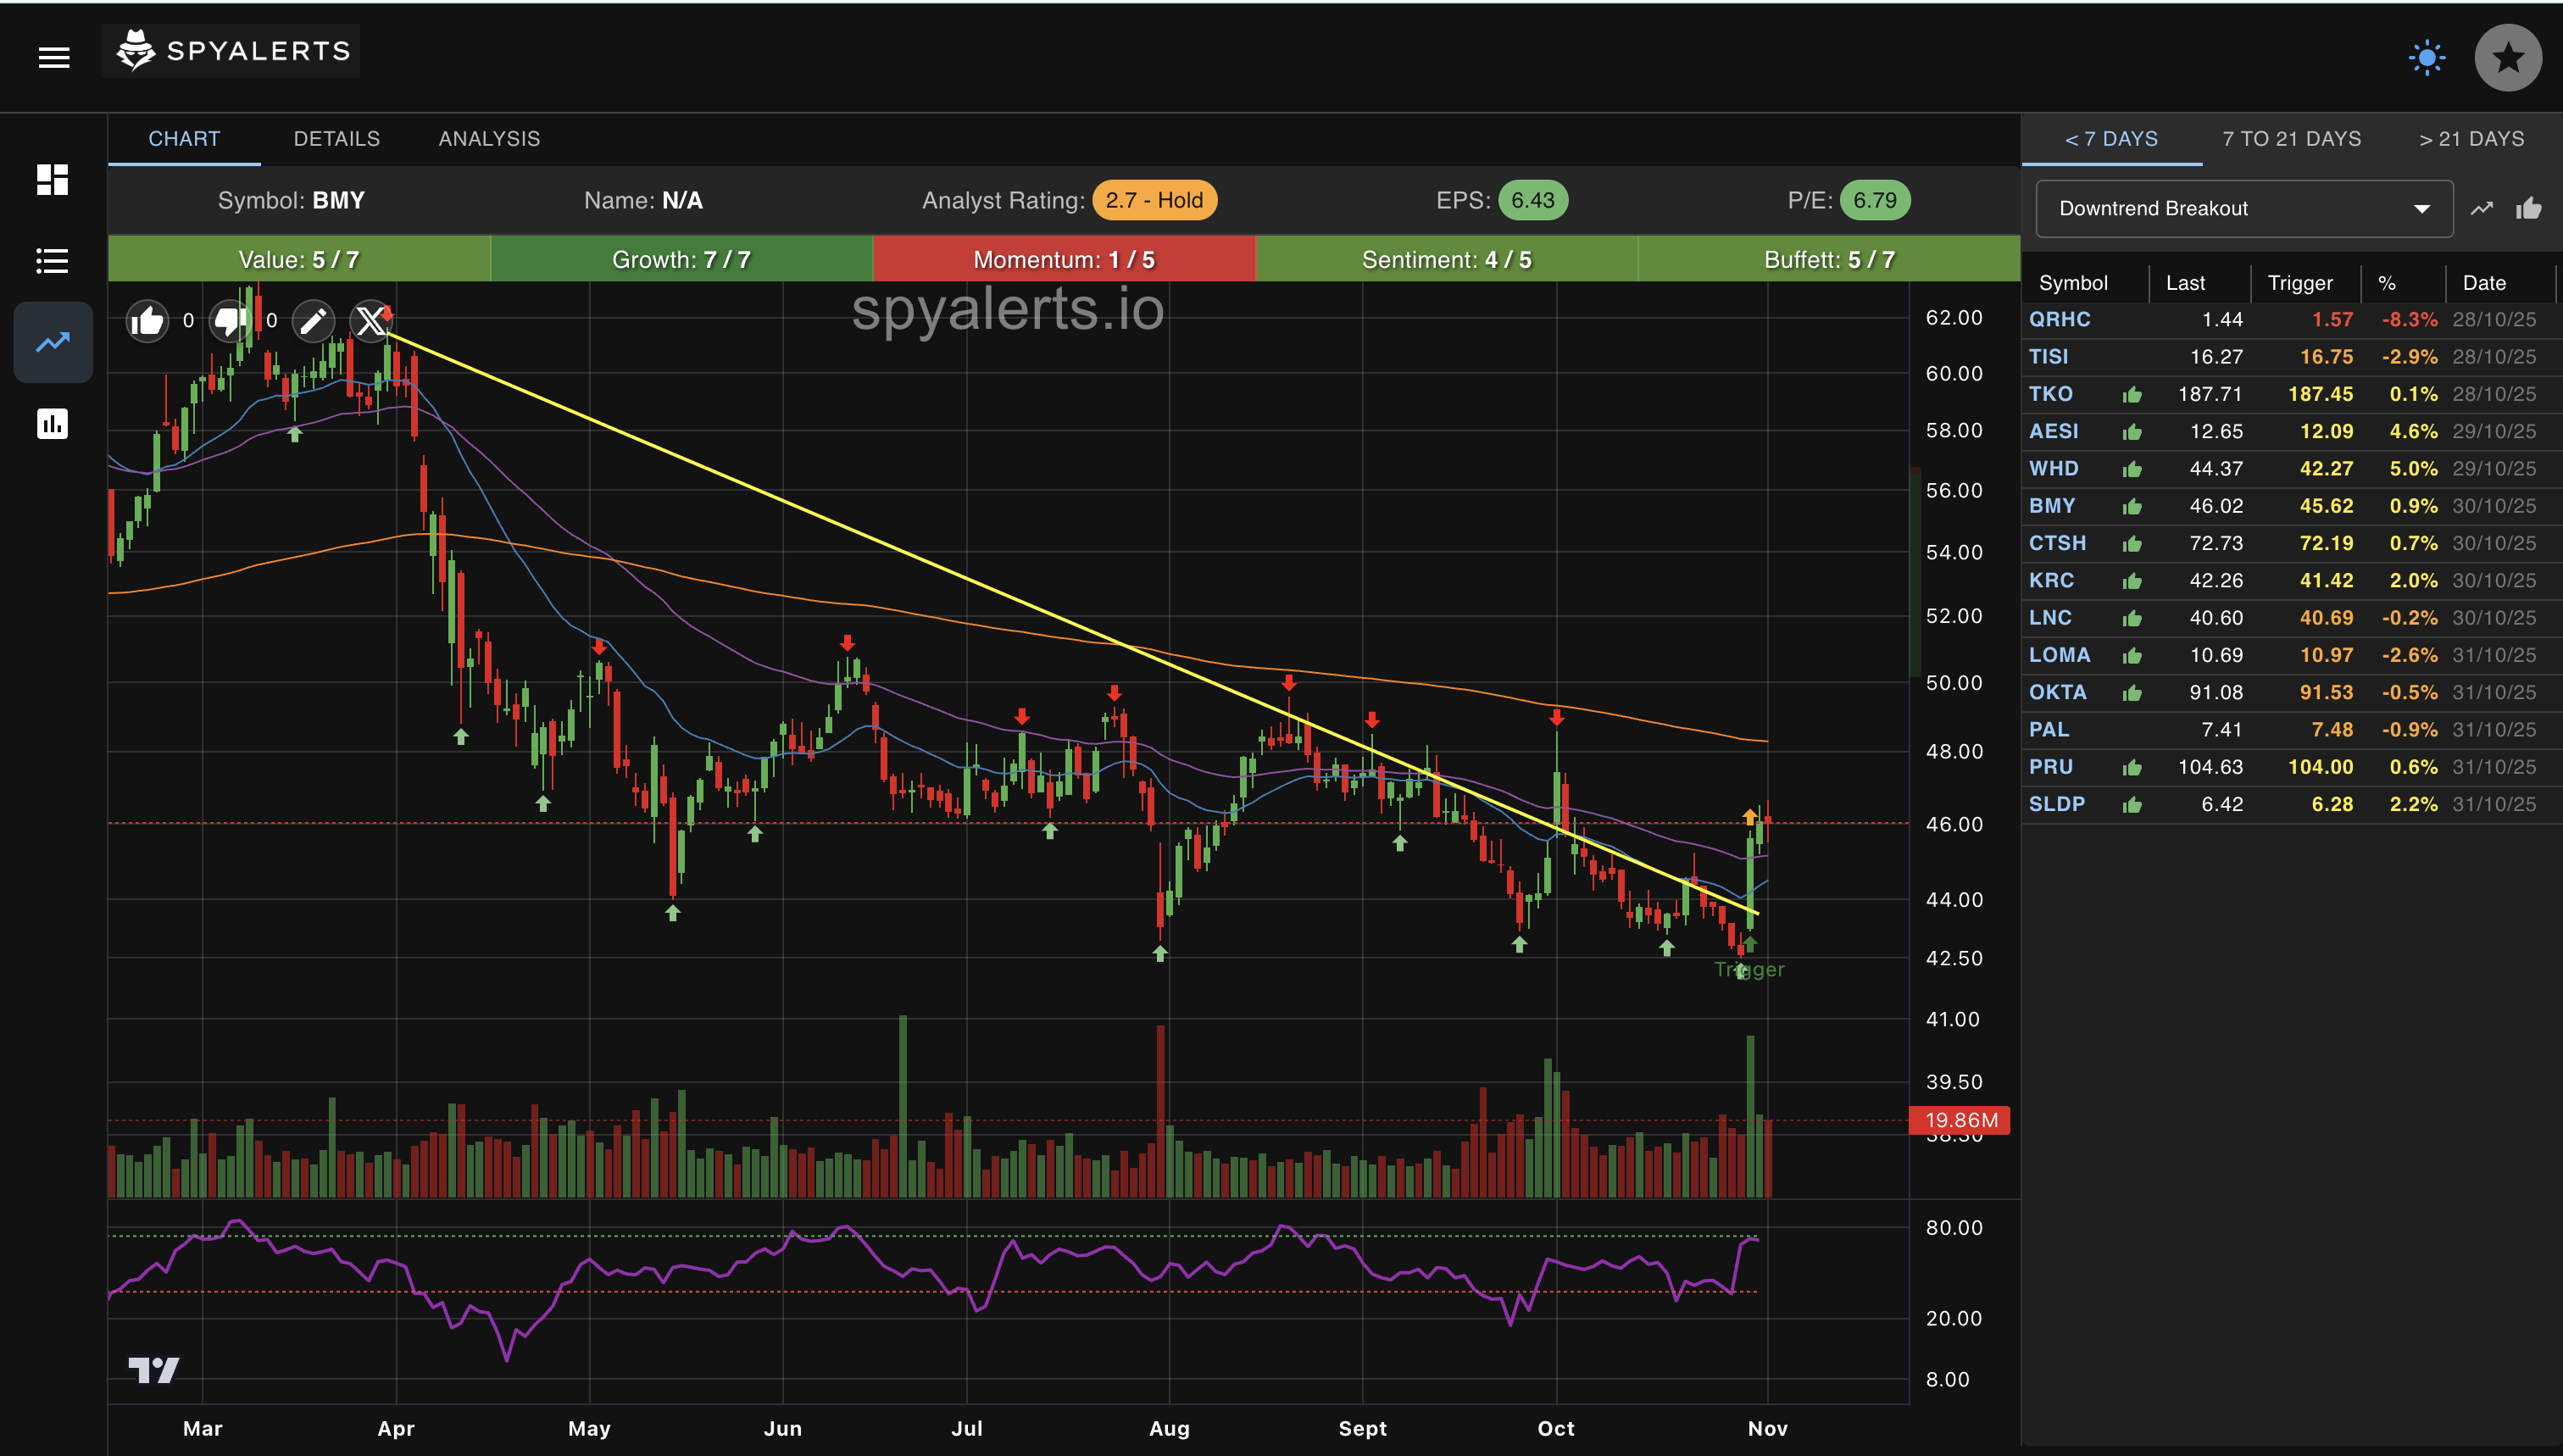
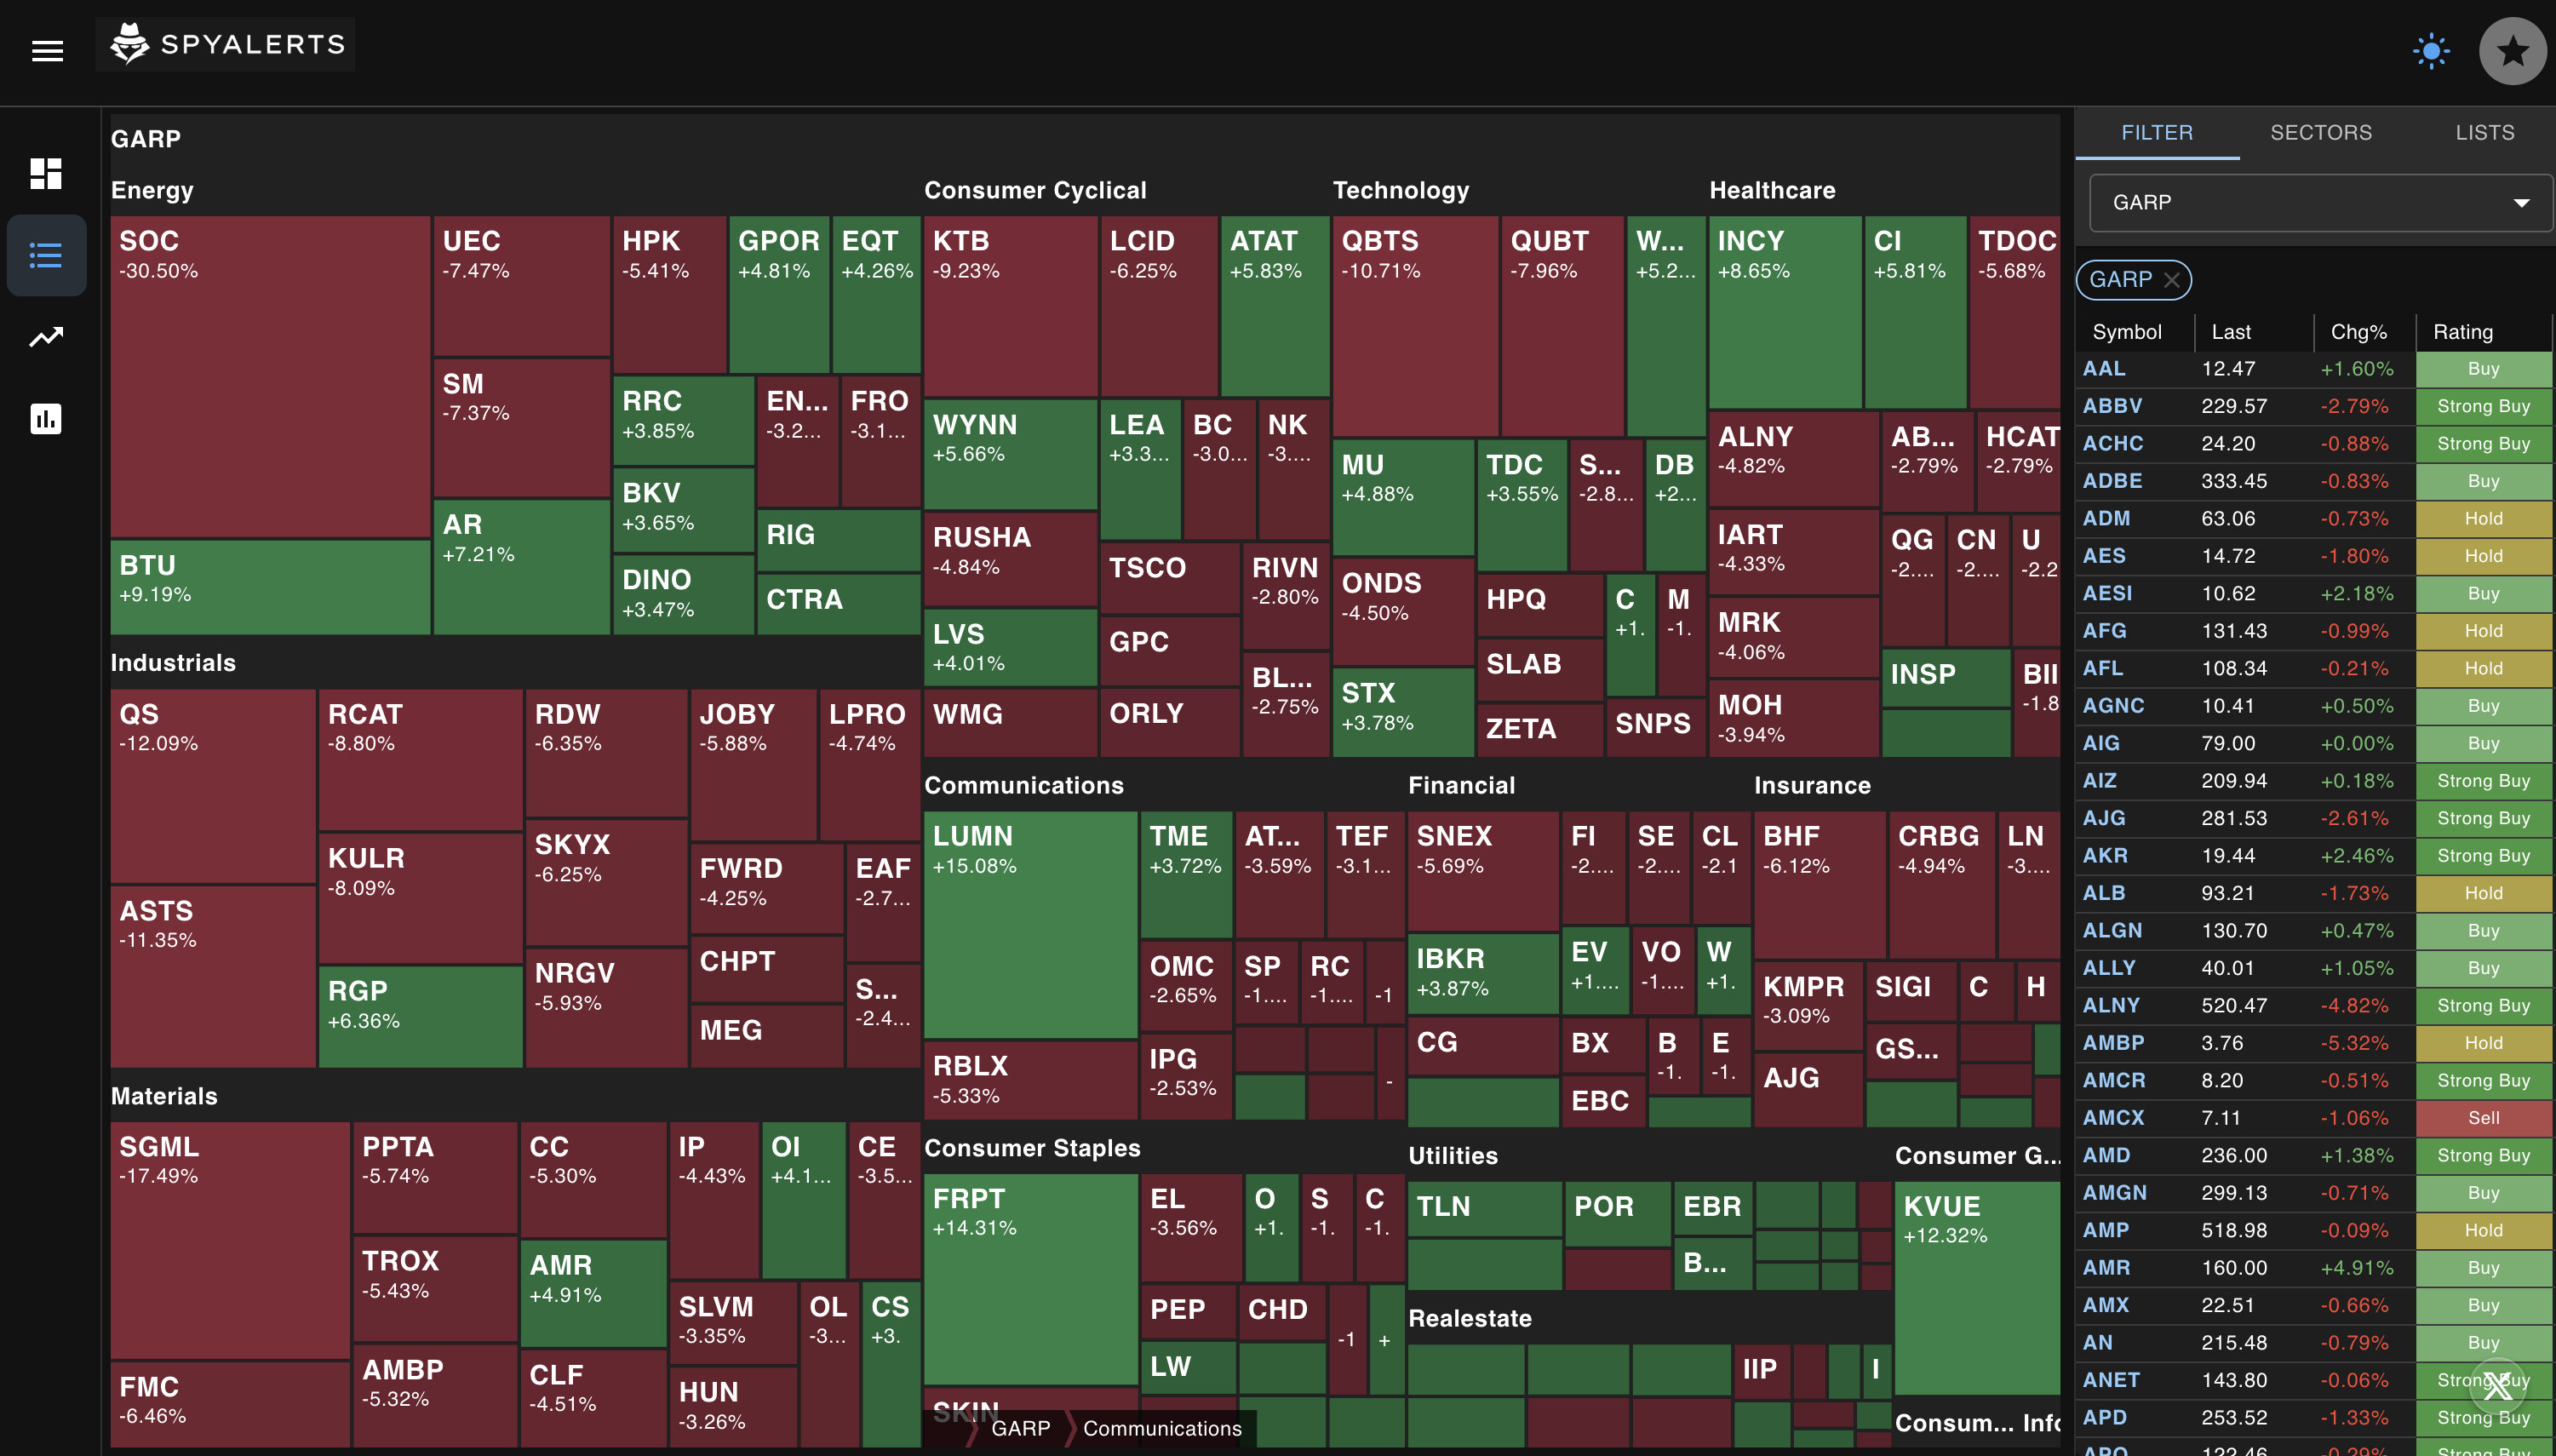
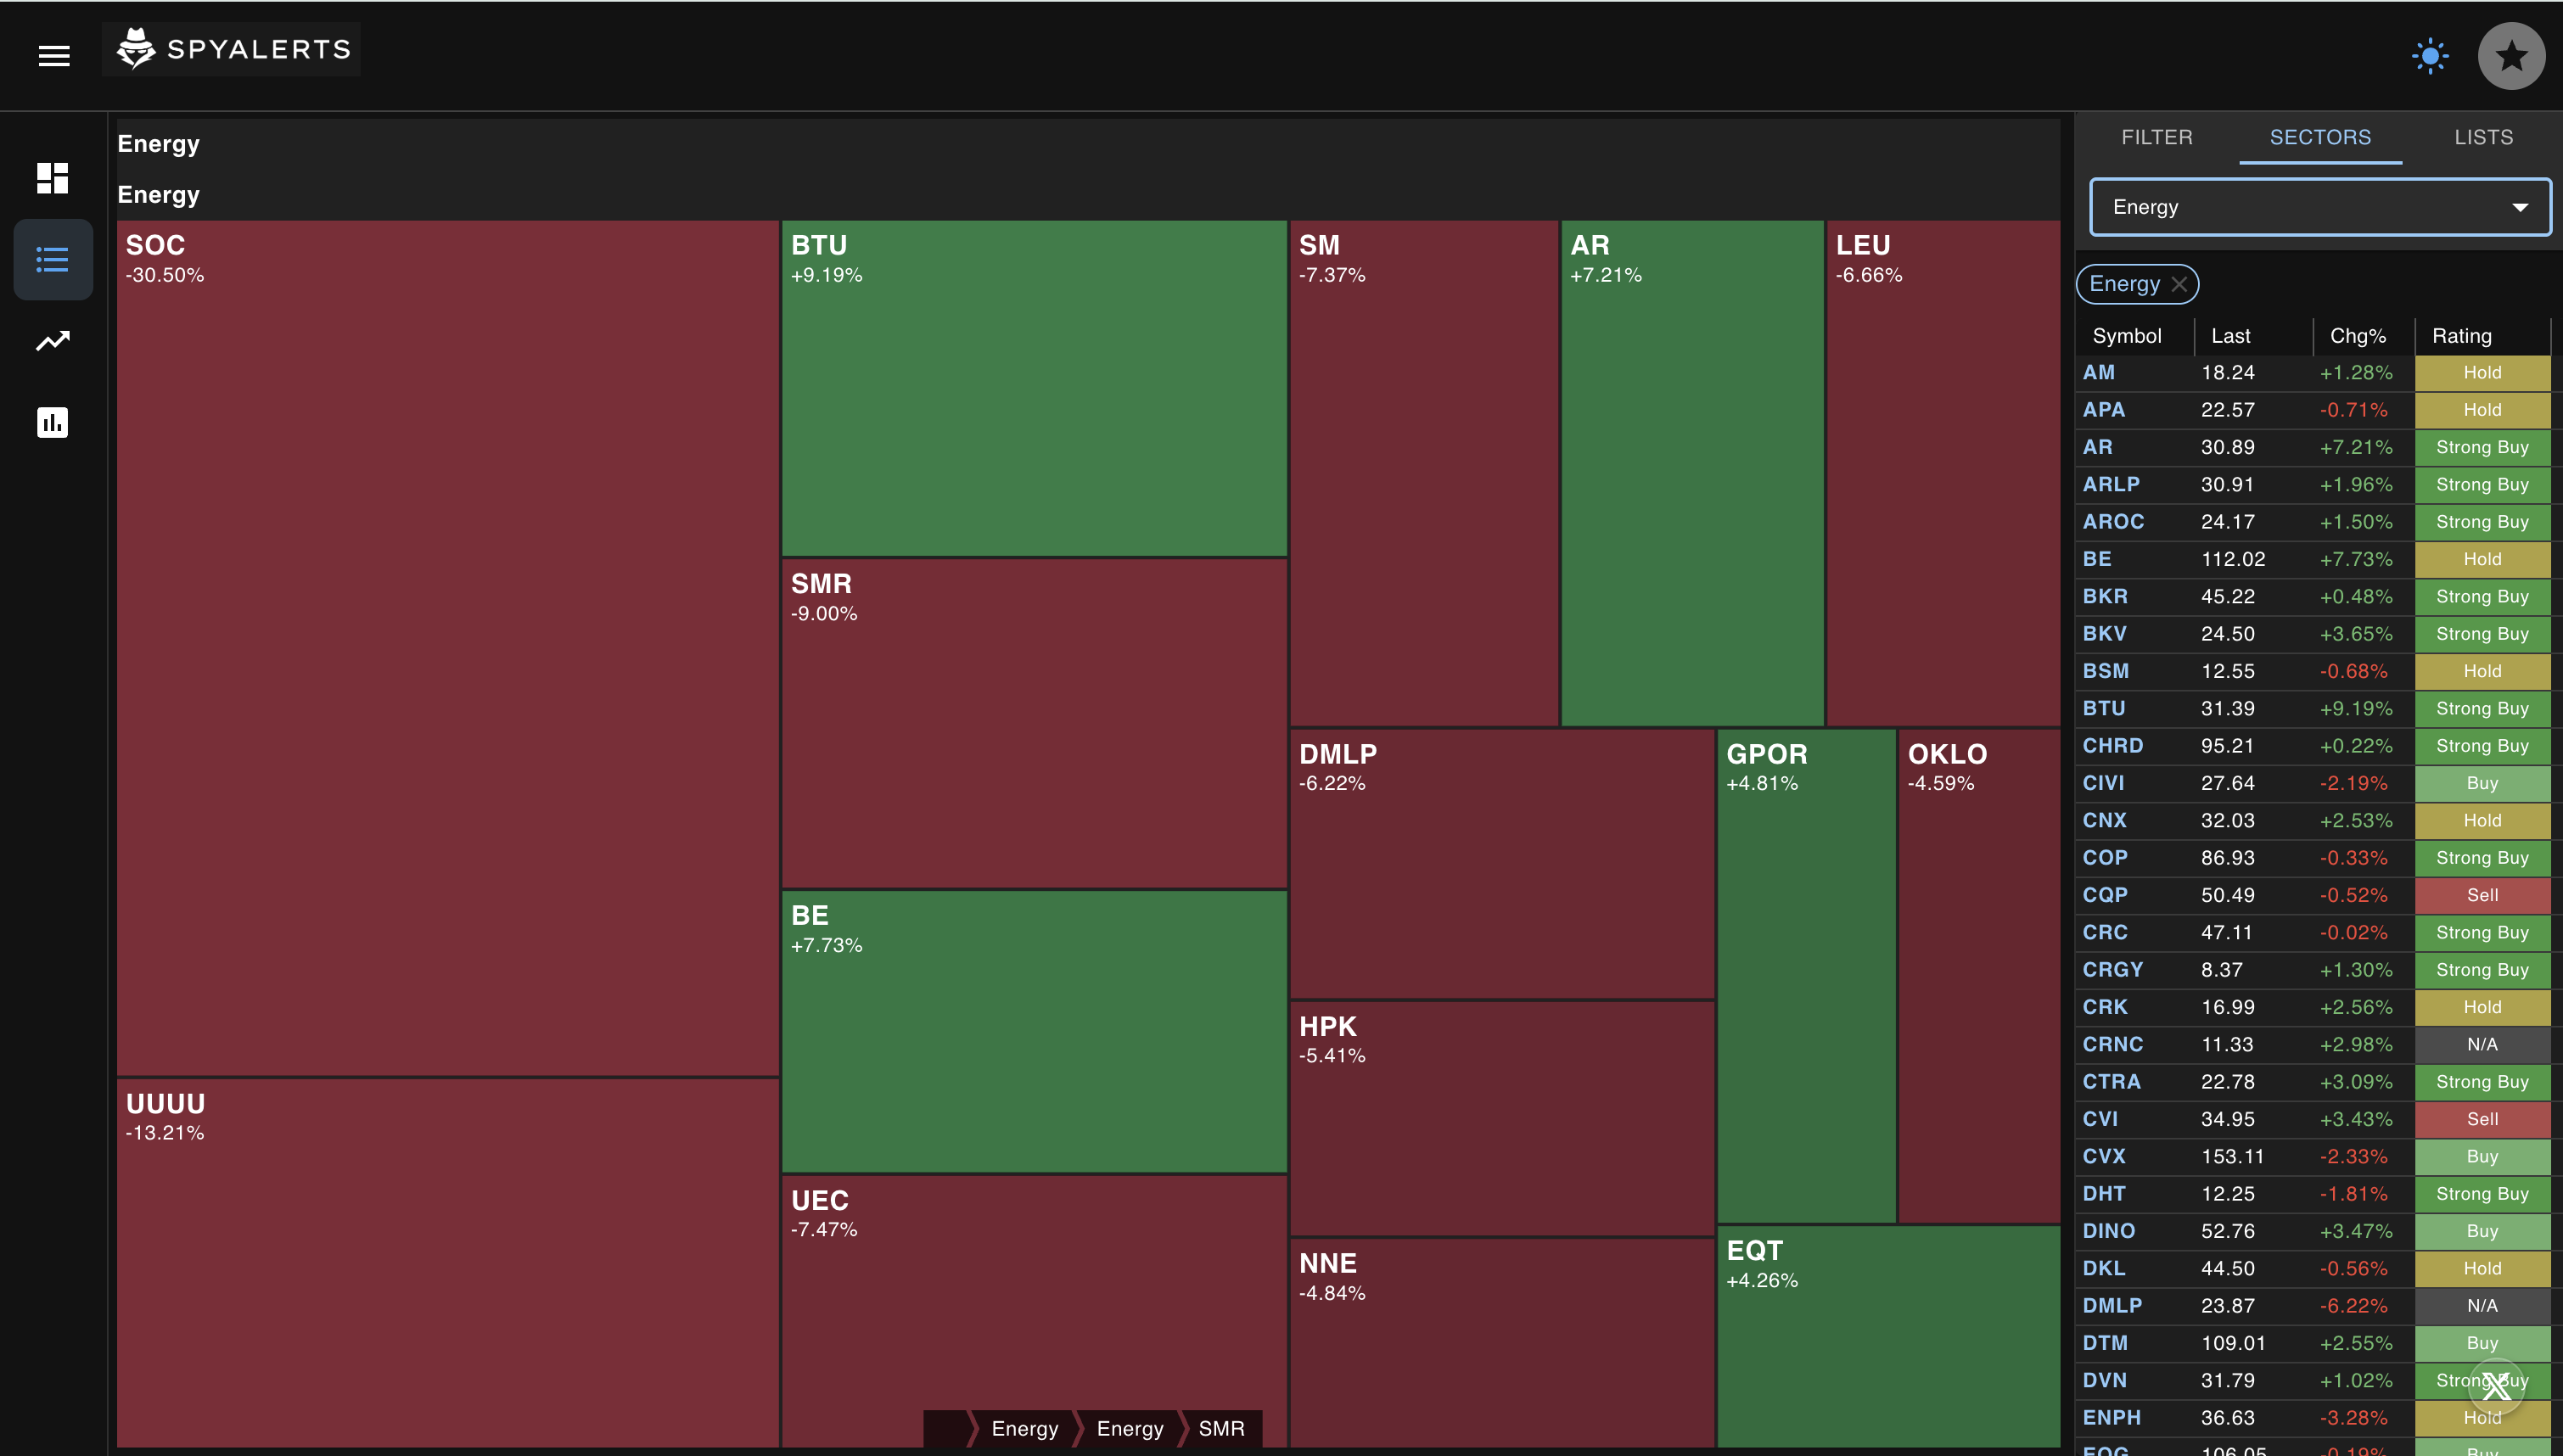
Get real-time stock market alerts and discover profitable trading patterns with our AI-powered platform. Receive daily alerts for 5 proven patterns: Cup & Handle, Head & Shoulders (bullish and bearish), Downtrends, Uptrends, and VWAP Price Levels across 1500+ US stocks including NASDAQ, Dow Jones, and S&P 500. Track your trades with our professional trading journal software.

SPYALERTS Head & Shoulders Pattern Detection - Cummins (CMI) Stock Analysis

Why SPYALERTS?

Trusted by traders for reliable pattern recognition

1,500+
US Stocks Analyzed

Comprehensive coverage of major US equities every week

80+
Pattern Alerts Per Week

High-quality signals delivered consistently every Saturday

6
Stock Classifications

Advanced categorization system for optimal portfolio management

AI-Powered Patterns

Our AI system continuously tracks and categorizes patterns across all monitored stocks. Filter patterns by age to find fresh opportunities or historical patterns. Sort by pattern type to focus on specific setups like downtrends, cup & handle, head & shoulders, and more.

Each pattern comes with detailed analysis, entry points, and performance metrics. Whether you're looking for recent formations or studying historical patterns, our intelligent filtering system helps you find exactly what you need.

AI Pattern Tracking Dashboard showing pattern filtering by age and type

Smart Stock Filters

Understanding key metrics tells you when stocks are at good prices and when to avoid overvalued traps

Buy & Strong Buy
Analyst-recommended stocks with Buy or Strong Buy ratings
GARP
Growth at a Reasonable Price - Balanced growth and value stocks
Momentum Play
Strong price movement and analyst optimism
Value Buy
Undervalued stocks, possibly out of favor
Buffett-Style Quality
High-quality businesses trading below 200-day MA
PEG Gap
Undervalued Growth - Fast EPS growth, low valuation

A heatmap visualization for each filter selected, makes it easy to identify stocks that match your criteria across multiple filters.

Filter Heatmap showing visual analysis of selected stock filters
Sector Filtering Heatmap showing sector-based stock analysis

Filter by Sector

Dive deep into specific sectors with our sector filtering capabilities. Whether you're focusing on technology, healthcare, finance, or any other sector, our heatmap visualization helps you quickly identify the best opportunities within your chosen sector.

Combine sector filtering with our smart stock filters to find the perfect stocks that match both your sector preference and investment criteria. The visual heatmap makes it easy to see which stocks stand out in each sector.

Custom Stock Lists

Create unlimited custom lists to organize stocks exactly how you want. Build watchlists, track specific sectors, or group stocks by strategy. Each list is fully customizable and can be updated at any time.

Track your trading performance with built-in trade management. Monitor open positions and analyze closed trades to improve your strategy. See which patterns led to profitable trades and which ones to avoid.

Custom Lists and Trade Tracking showing open and closed trades
Stock Details Screenshot showing color-coded metrics

Stock Metrics Made Easy

Our revolutionary color-coded system instantly reveals which metrics matter most for your investment decisions. P/E ratios, EPS growth, dividend yields, and sentiment scores are color-coded to show strength or weakness. Indicators either signal strong, neutral or weak metrics.

Color coding gives you an instant indication of whether each metric is good or bad. Our system analyzes sentiment, growth, value, and momentum - all the factors professional traders use to make decisions.

Stop wasting hours on complex financial analysis. Our dashboard gives you institutional-grade insights in seconds.

Stock Analysis Metrics

Stop guessing what P/E ratios and EPS numbers mean. Our system breaks down trailing, current, and forward metrics so you instantly know if a stock is worth your money. Trailing metrics show proven performance, current metrics reveal present value, and forward metrics predict future growth.

Don't let Wall Street's confusing metrics fool you. Our dashboard translates every number into actionable insights, giving you the same analytical power that professional traders use to spot winners and avoid losers.

Stock Analysis Dashboard showing key metrics and indicators
X Social Posting feature showing handy X button on charts and lists

Build Your Social Presence on X

Build your social presence on X (formerly Twitter) with our convenient posting feature. Every chart and list comes with a handy X button that lets you share your analysis, patterns, and insights with your followers in just one click.

Whether you're sharing a winning pattern, discussing a stock analysis, or showcasing your trading strategy, our integrated X posting feature makes it effortless to grow your trading community and establish yourself as a thought leader in the trading space.

Track performance with our Trading Journal

Master your trading strategy with our comprehensive Trade Journal. Track every trade, analyze your performance, and learn from both your successes and mistakes. Monitor key metrics like win rate, profit factor, average hold time, and monthly P&L.

The Summary dashboard gives you a complete overview of your trading activity, showing total trades, net P&L, average win/loss, and your best trade. This data-driven approach helps you identify patterns in your trading behavior and make informed decisions about your strategy.

Trading Journal Summary Dashboard showing key trading metrics and performance statistics

What Traders Are Saying

Join hundreds of traders who've transformed their strategy with SPYALERTS

"SPYALERTS saved me hours of chart analysis. I caught a perfect Cup & Handle on NVDA that returned 23% in 3 weeks. The color-coded metrics make it so easy to spot quality setups."

MR
Michael R.
Day Trader

"I was skeptical at first, but the pattern accuracy is incredible. Hit an 87% win rate on Head & Shoulders patterns last quarter. Best $20/month I spend on trading tools."

JC
Jennifer C.
Swing Trader

"The GARP and Momentum Play filters changed my game. No more guessing on valuations. I'm finding quality setups consistently now. Worth way more than the price tag."

DK
David K.
Portfolio Manager

Frequently Asked Questions

Everything you need to know about SPYALERTS

Our AI-powered system achieves 65%+ historical accuracy on pattern detection. We analyze over 1,500 stocks weekly using institutional-grade algorithms that have been tested against years of market data. Each pattern is validated using multiple technical indicators before being flagged as an alert.

New pattern alerts are delivered every Saturday morning, giving you the weekend to analyze opportunities before the market opens Monday. You get 80+ high-quality alerts per week, all accessible through your dashboard with full historical data.

Absolutely! Your subscription is managed through PayPal, giving you complete control. You can pause, resume, or cancel your subscription at any time directly from your PayPal account. No long-term commitments, no hidden fees.

We detect 5 proven technical patterns: Cup & Handle, Head & Shoulders (bullish and bearish), Downtrends, Uptrends, and VWAP Price Levels. Each pattern comes with detailed charts, entry/exit points, and historical performance data to help you make informed decisions.

Yes! We offer a 14-day money-back guarantee. If you're not satisfied with SPYALERTS for any reason, contact our support team within 14 days of your purchase for a full refund. Plus, your first month is 50% off, so you can try it for just $10.

Unlike generic stock apps, we combine pattern recognition with intelligent stock classifications (GARP, Momentum Play, Value Buy, etc.) and color-coded fundamental metrics. You get both technical and fundamental analysis in one place, at a fraction of the cost of premium services like Trade Ideas ($99+/month).

Stock prices are updated daily to ensure you always have the most current market data. This keeps your analysis accurate and up-to-date with the latest trading information.

Patterns are updated weekly, every weekend. This gives you fresh pattern alerts every Saturday morning, allowing you to review new opportunities before the market opens on Monday.

Ready to Trade Smarter?

Trusted by traders worldwide who've transformed their strategy with institutional-grade pattern recognition. First month just $10 (50% off).

  • 14-Day Money-Back Guarantee
  • Cancel Anytime via PayPal
  • 85%+ Pattern Accuracy
  • 80+ Weekly Alerts on 1,500+ Stocks
First Month
$10
Regular $20/month
View Pricing