Master the Art of Pattern Trading

Our AI-powered system scans daily charts on a weekly basis, identifying complex technical patterns with surgical precision. This strategic approach gives you the edge and allows you to discover the patterns that professional traders rely on to generate consistent profits and manage risk effectively.

Advanced Stock Filtering

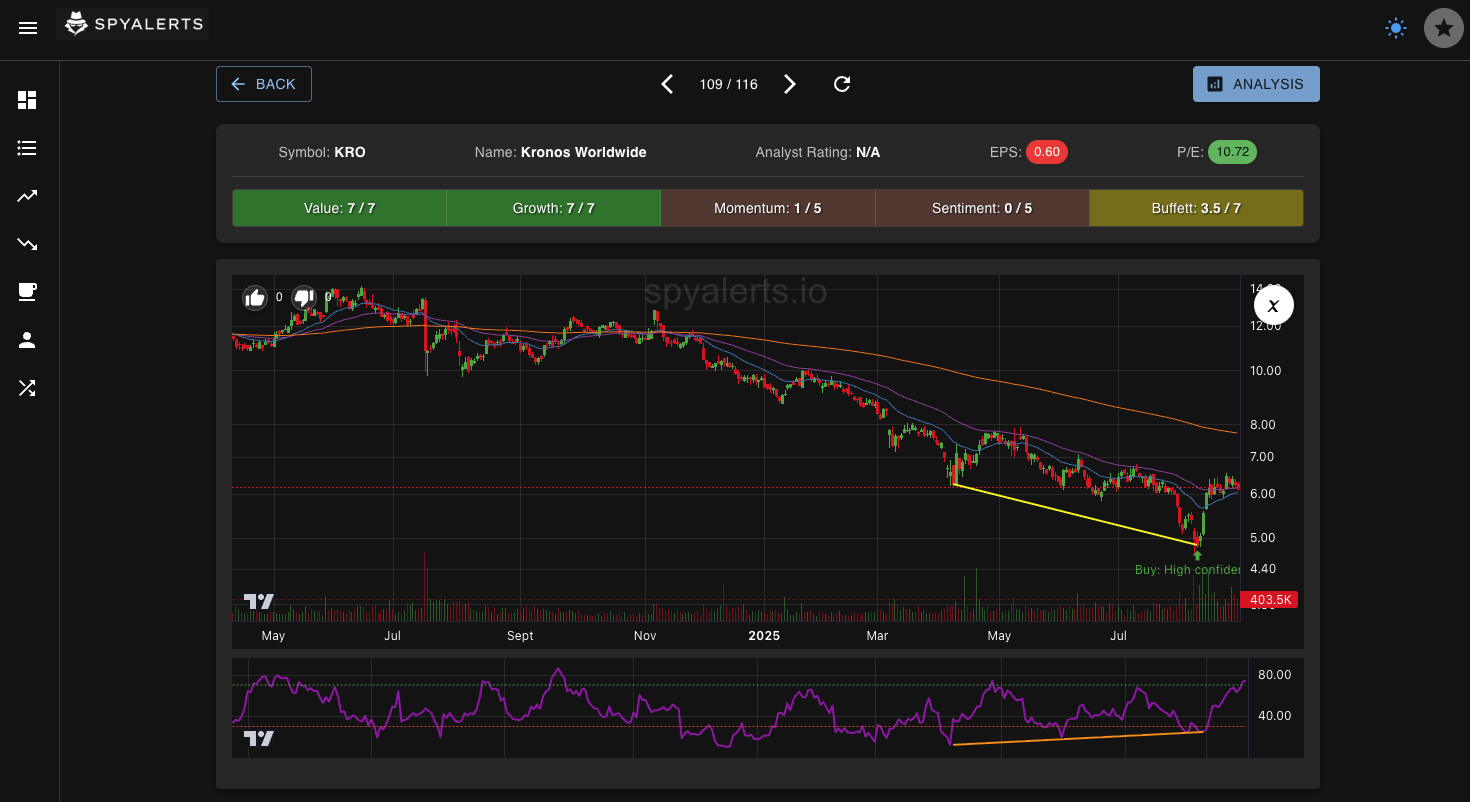
Transform your trading strategy with our intelligent stock filtering system. Our AI analyzes thousands of stocks daily, identifying only the most promising opportunities.

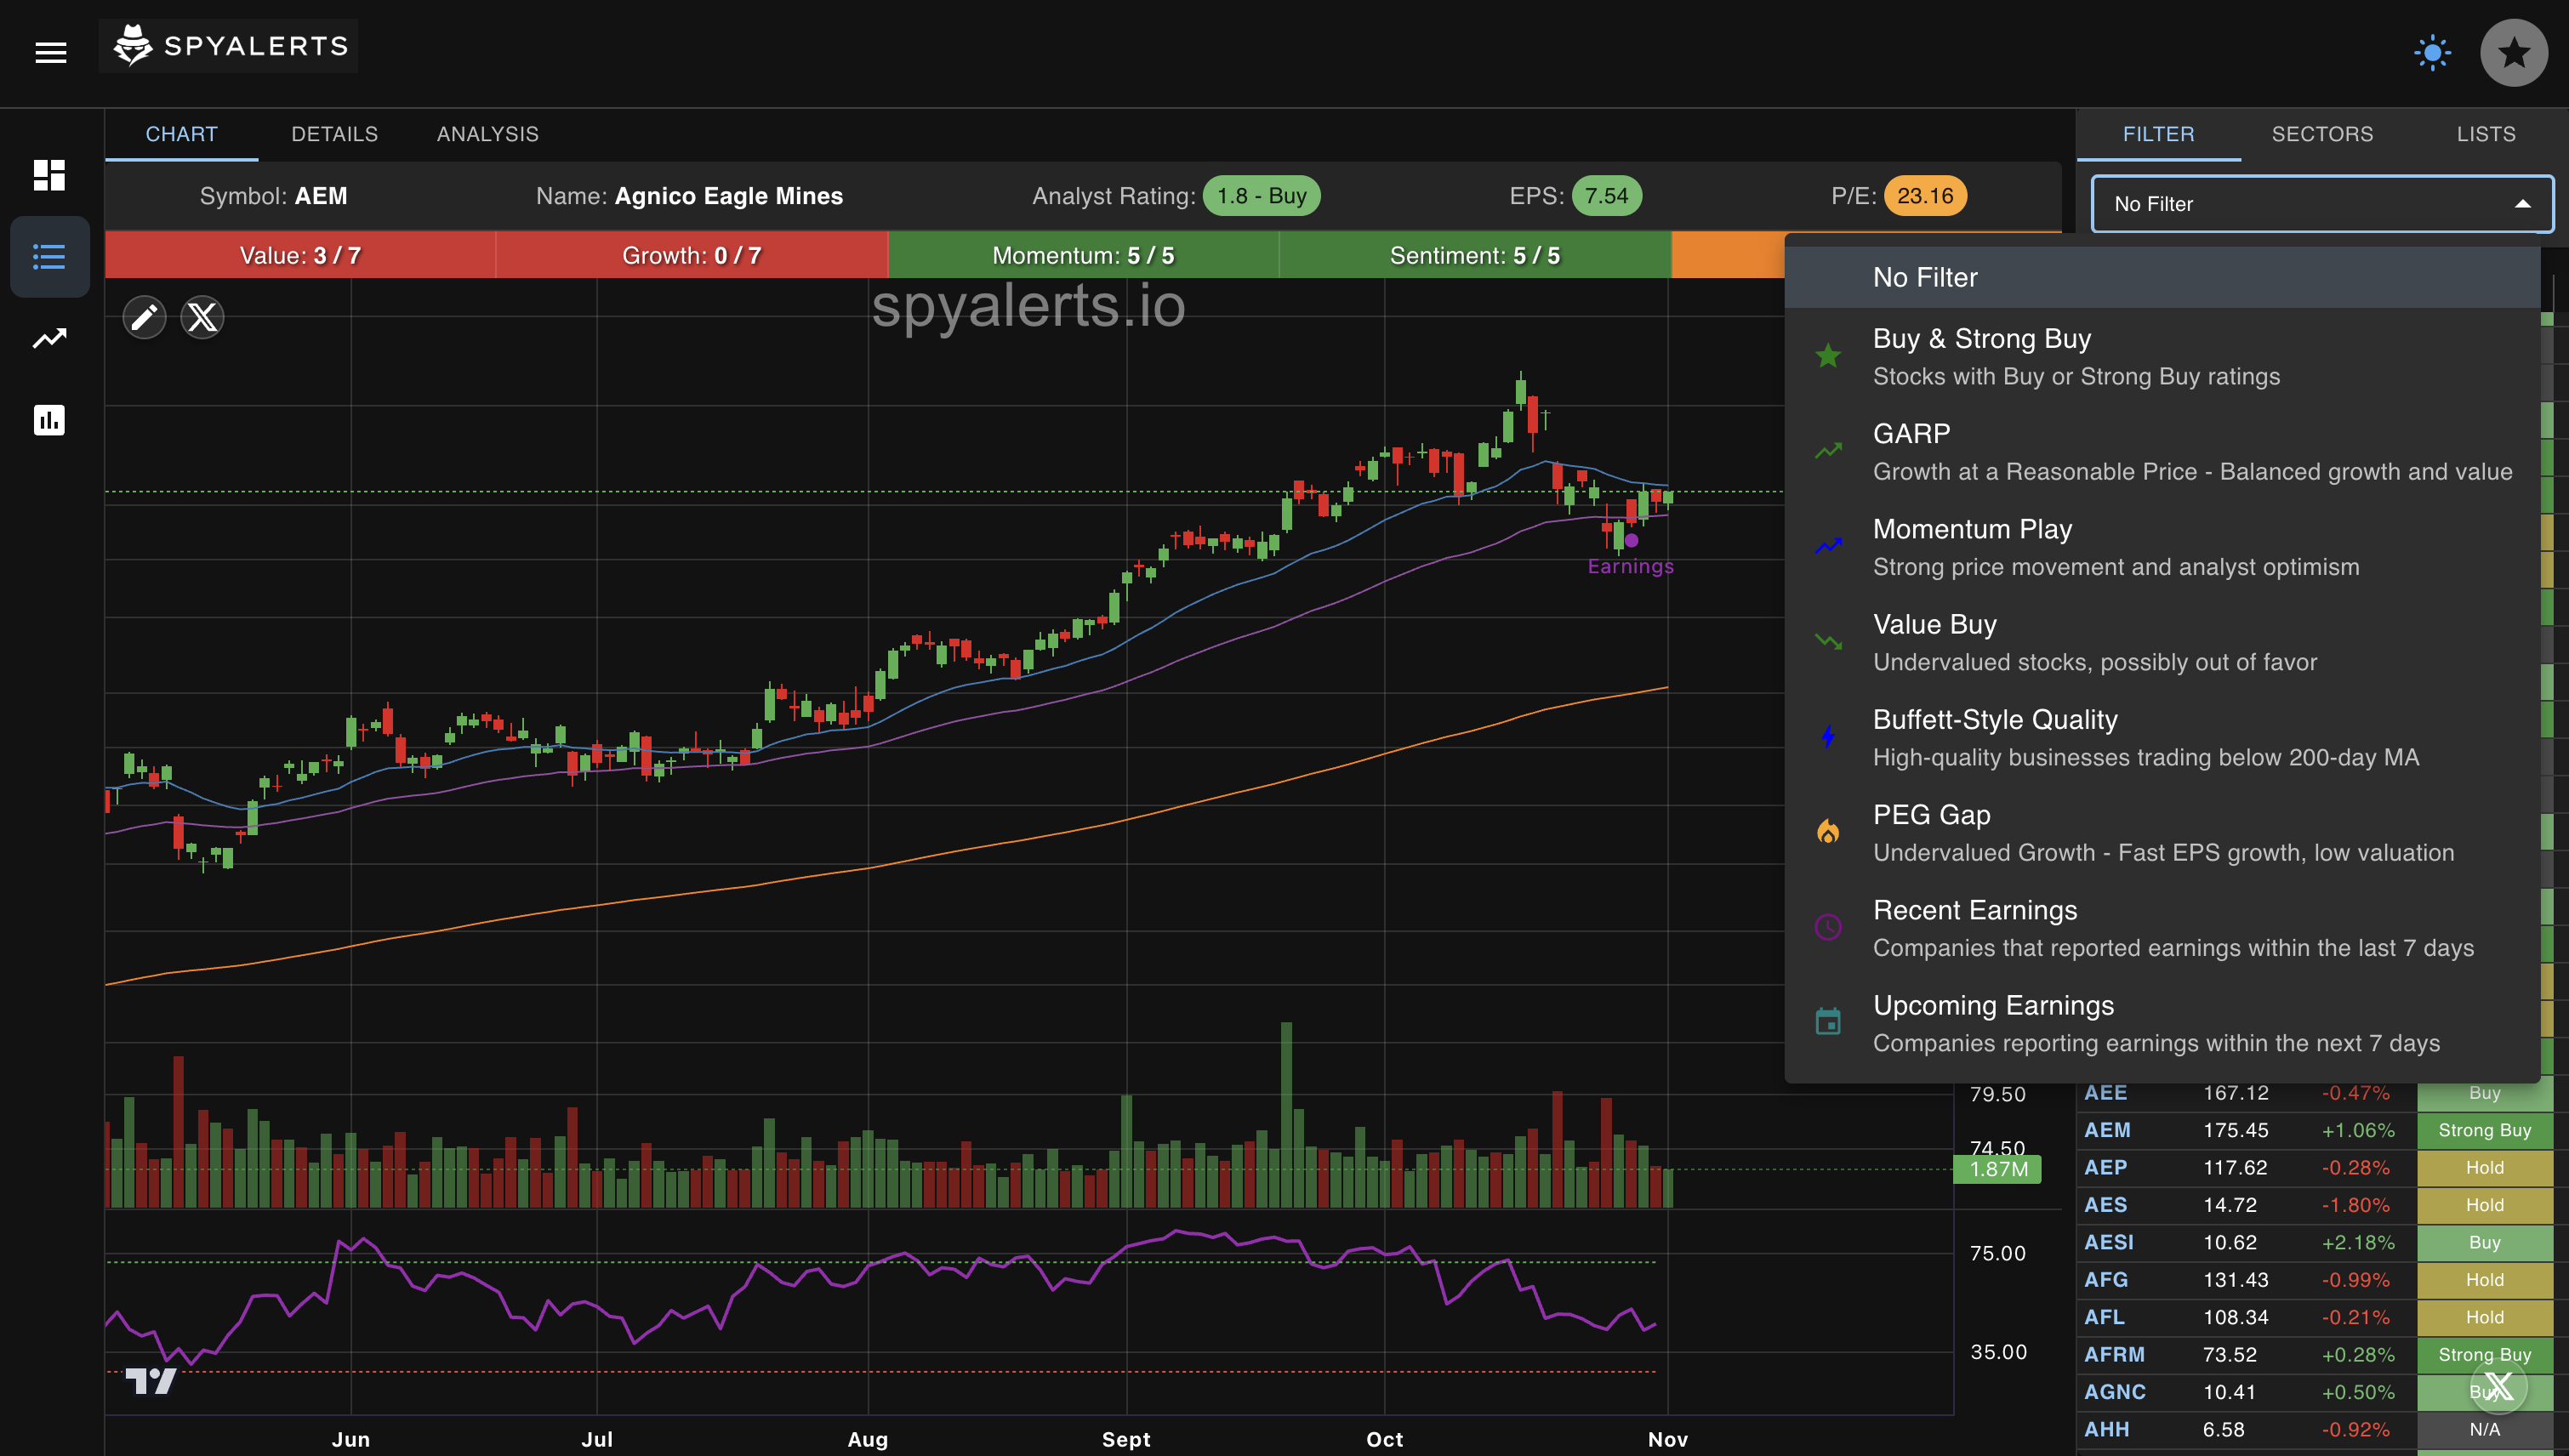
By filtering stocks based on volume, price action, and technical indicators, you can focus your attention on high-probability setups. This systematic approach eliminates emotional decision-making and ensures you're only trading stocks with the highest potential for success.

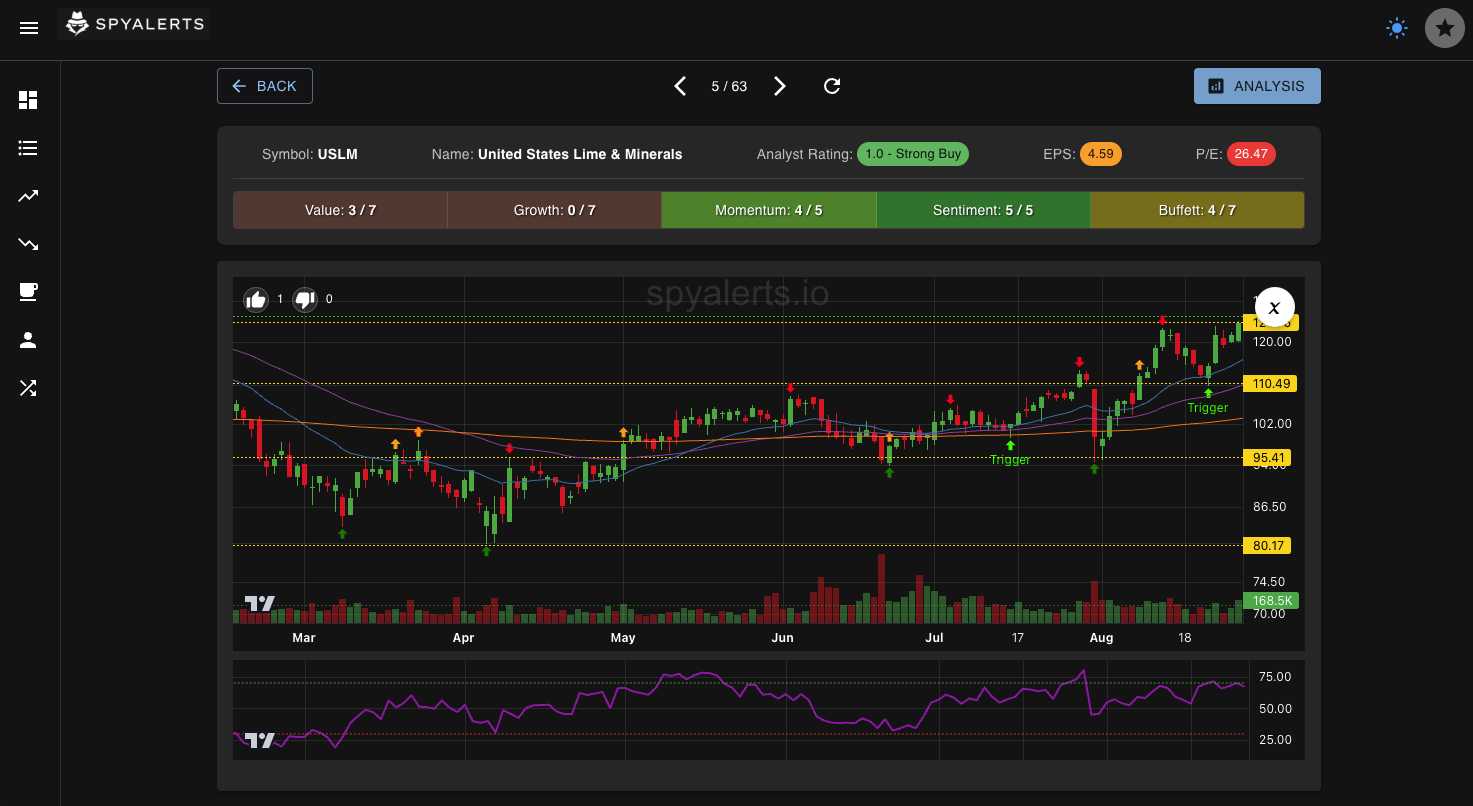
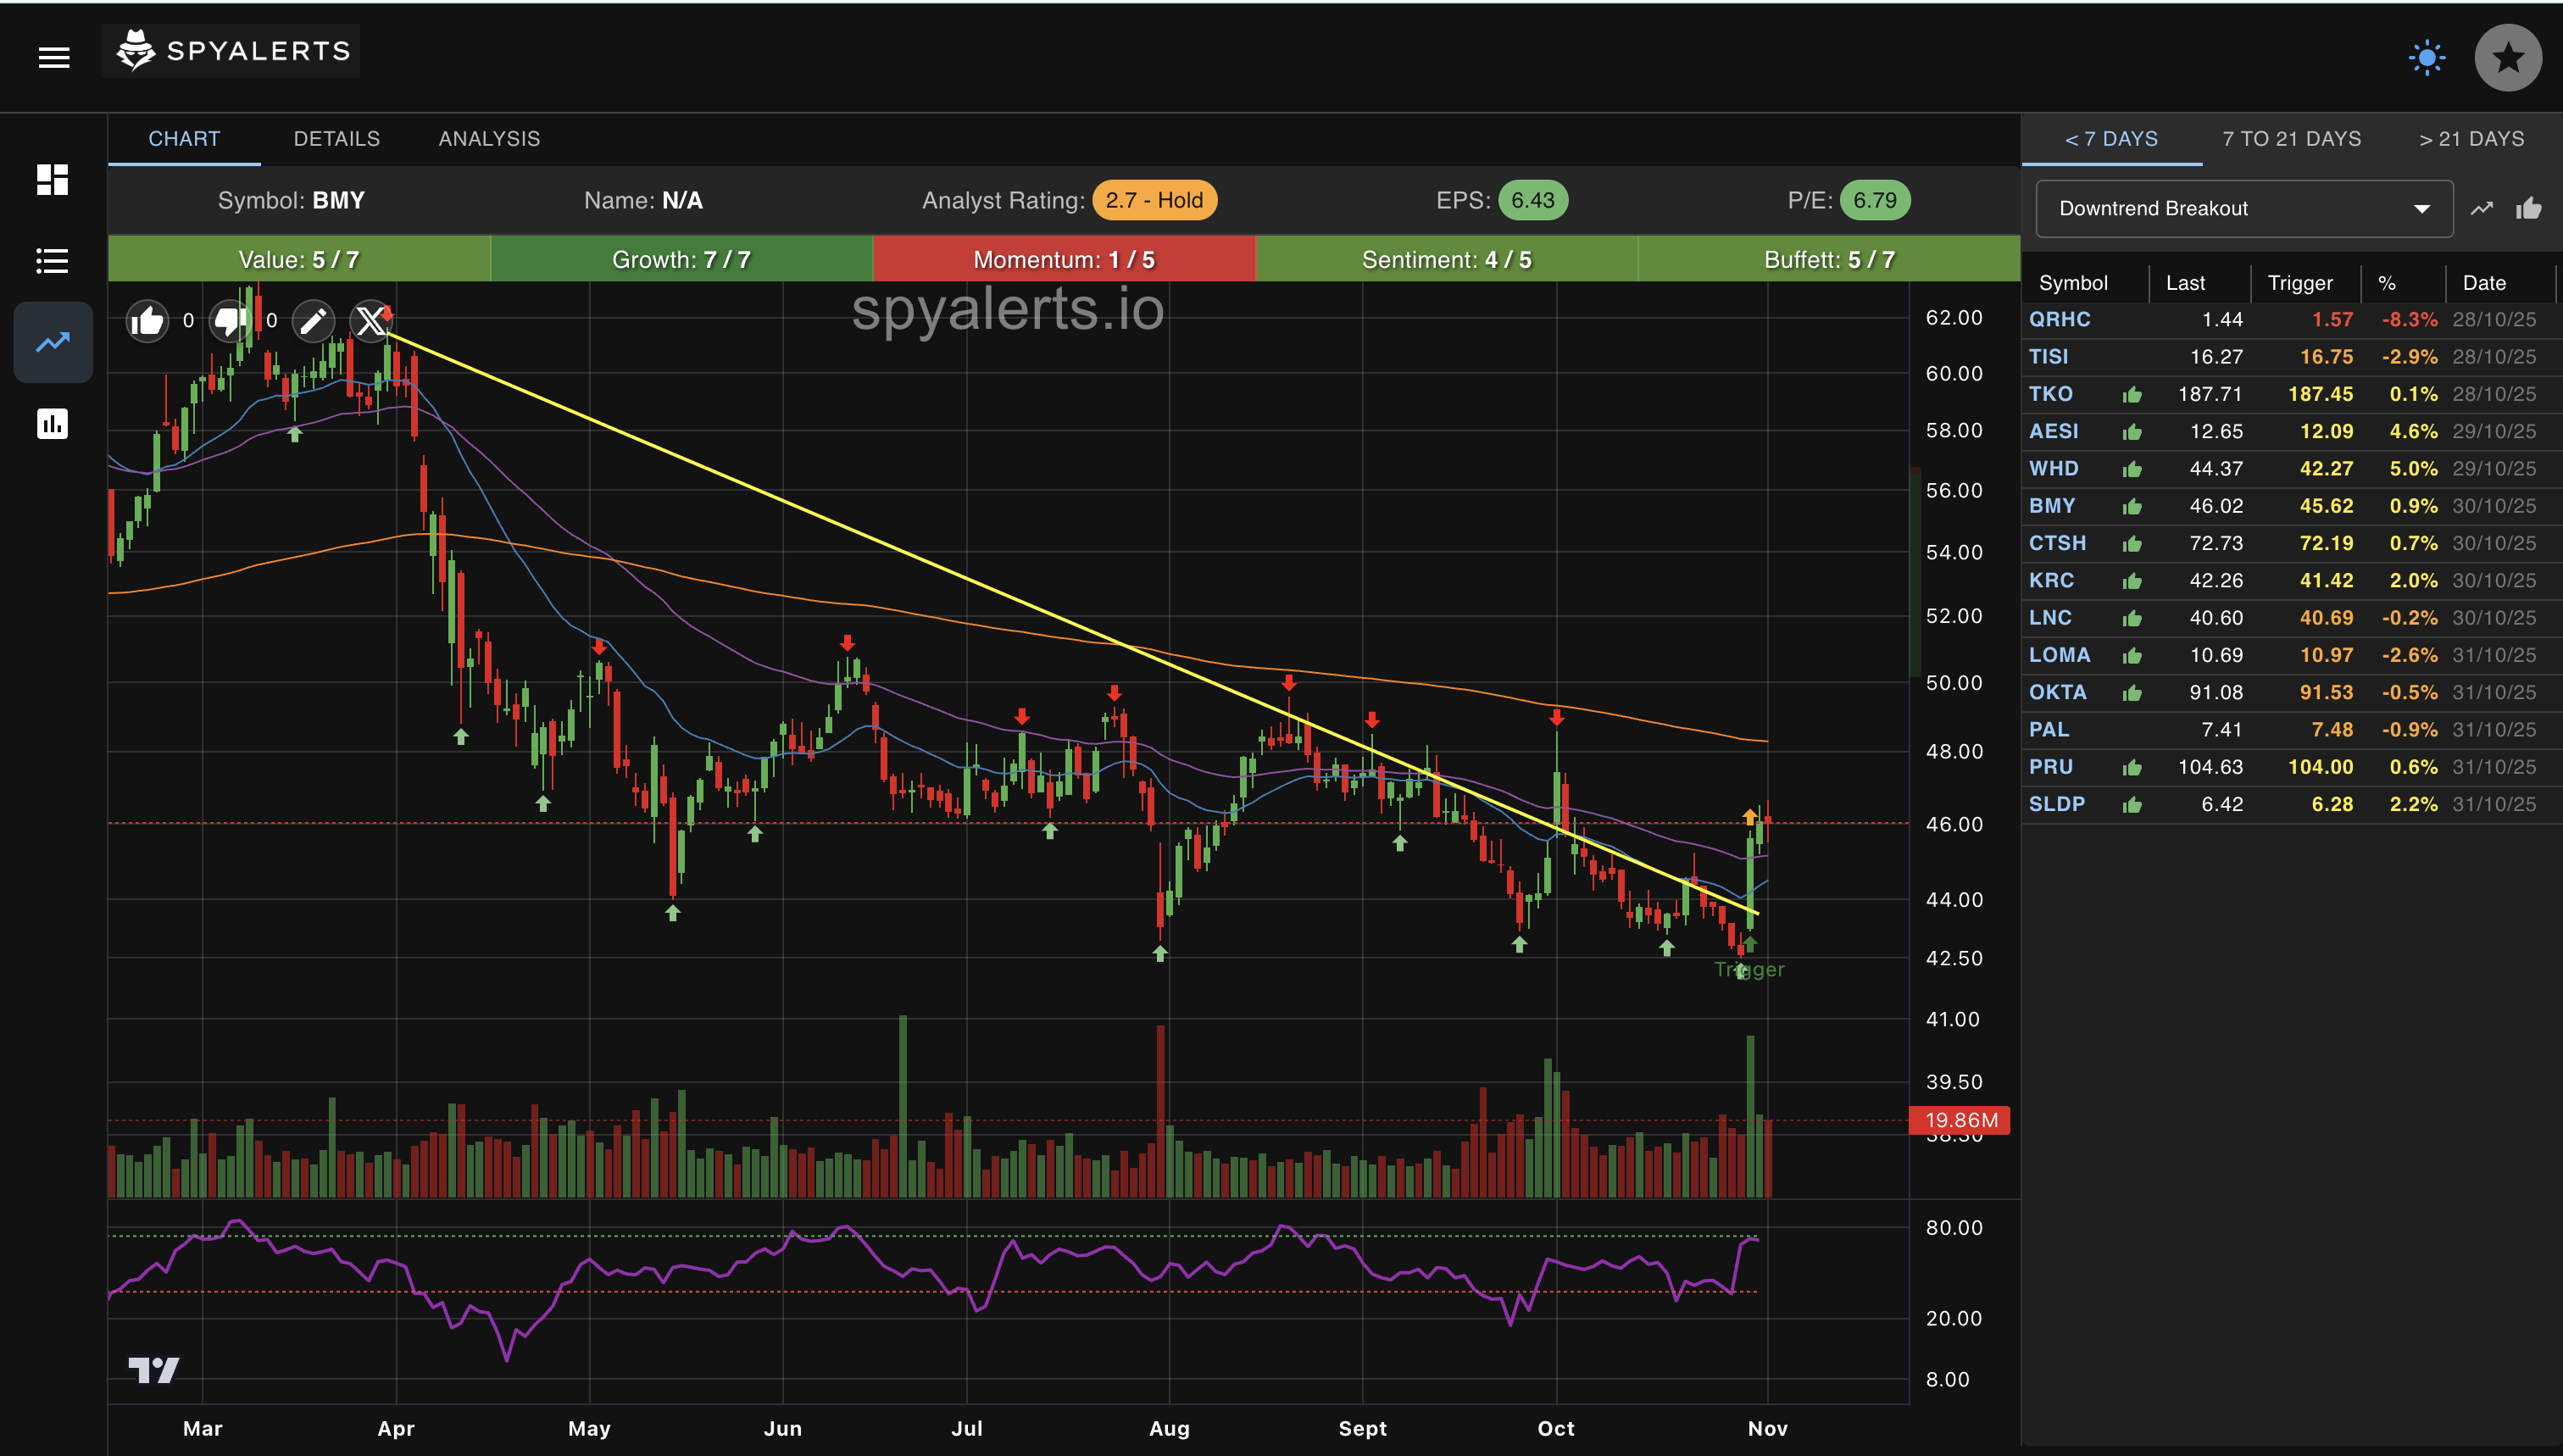
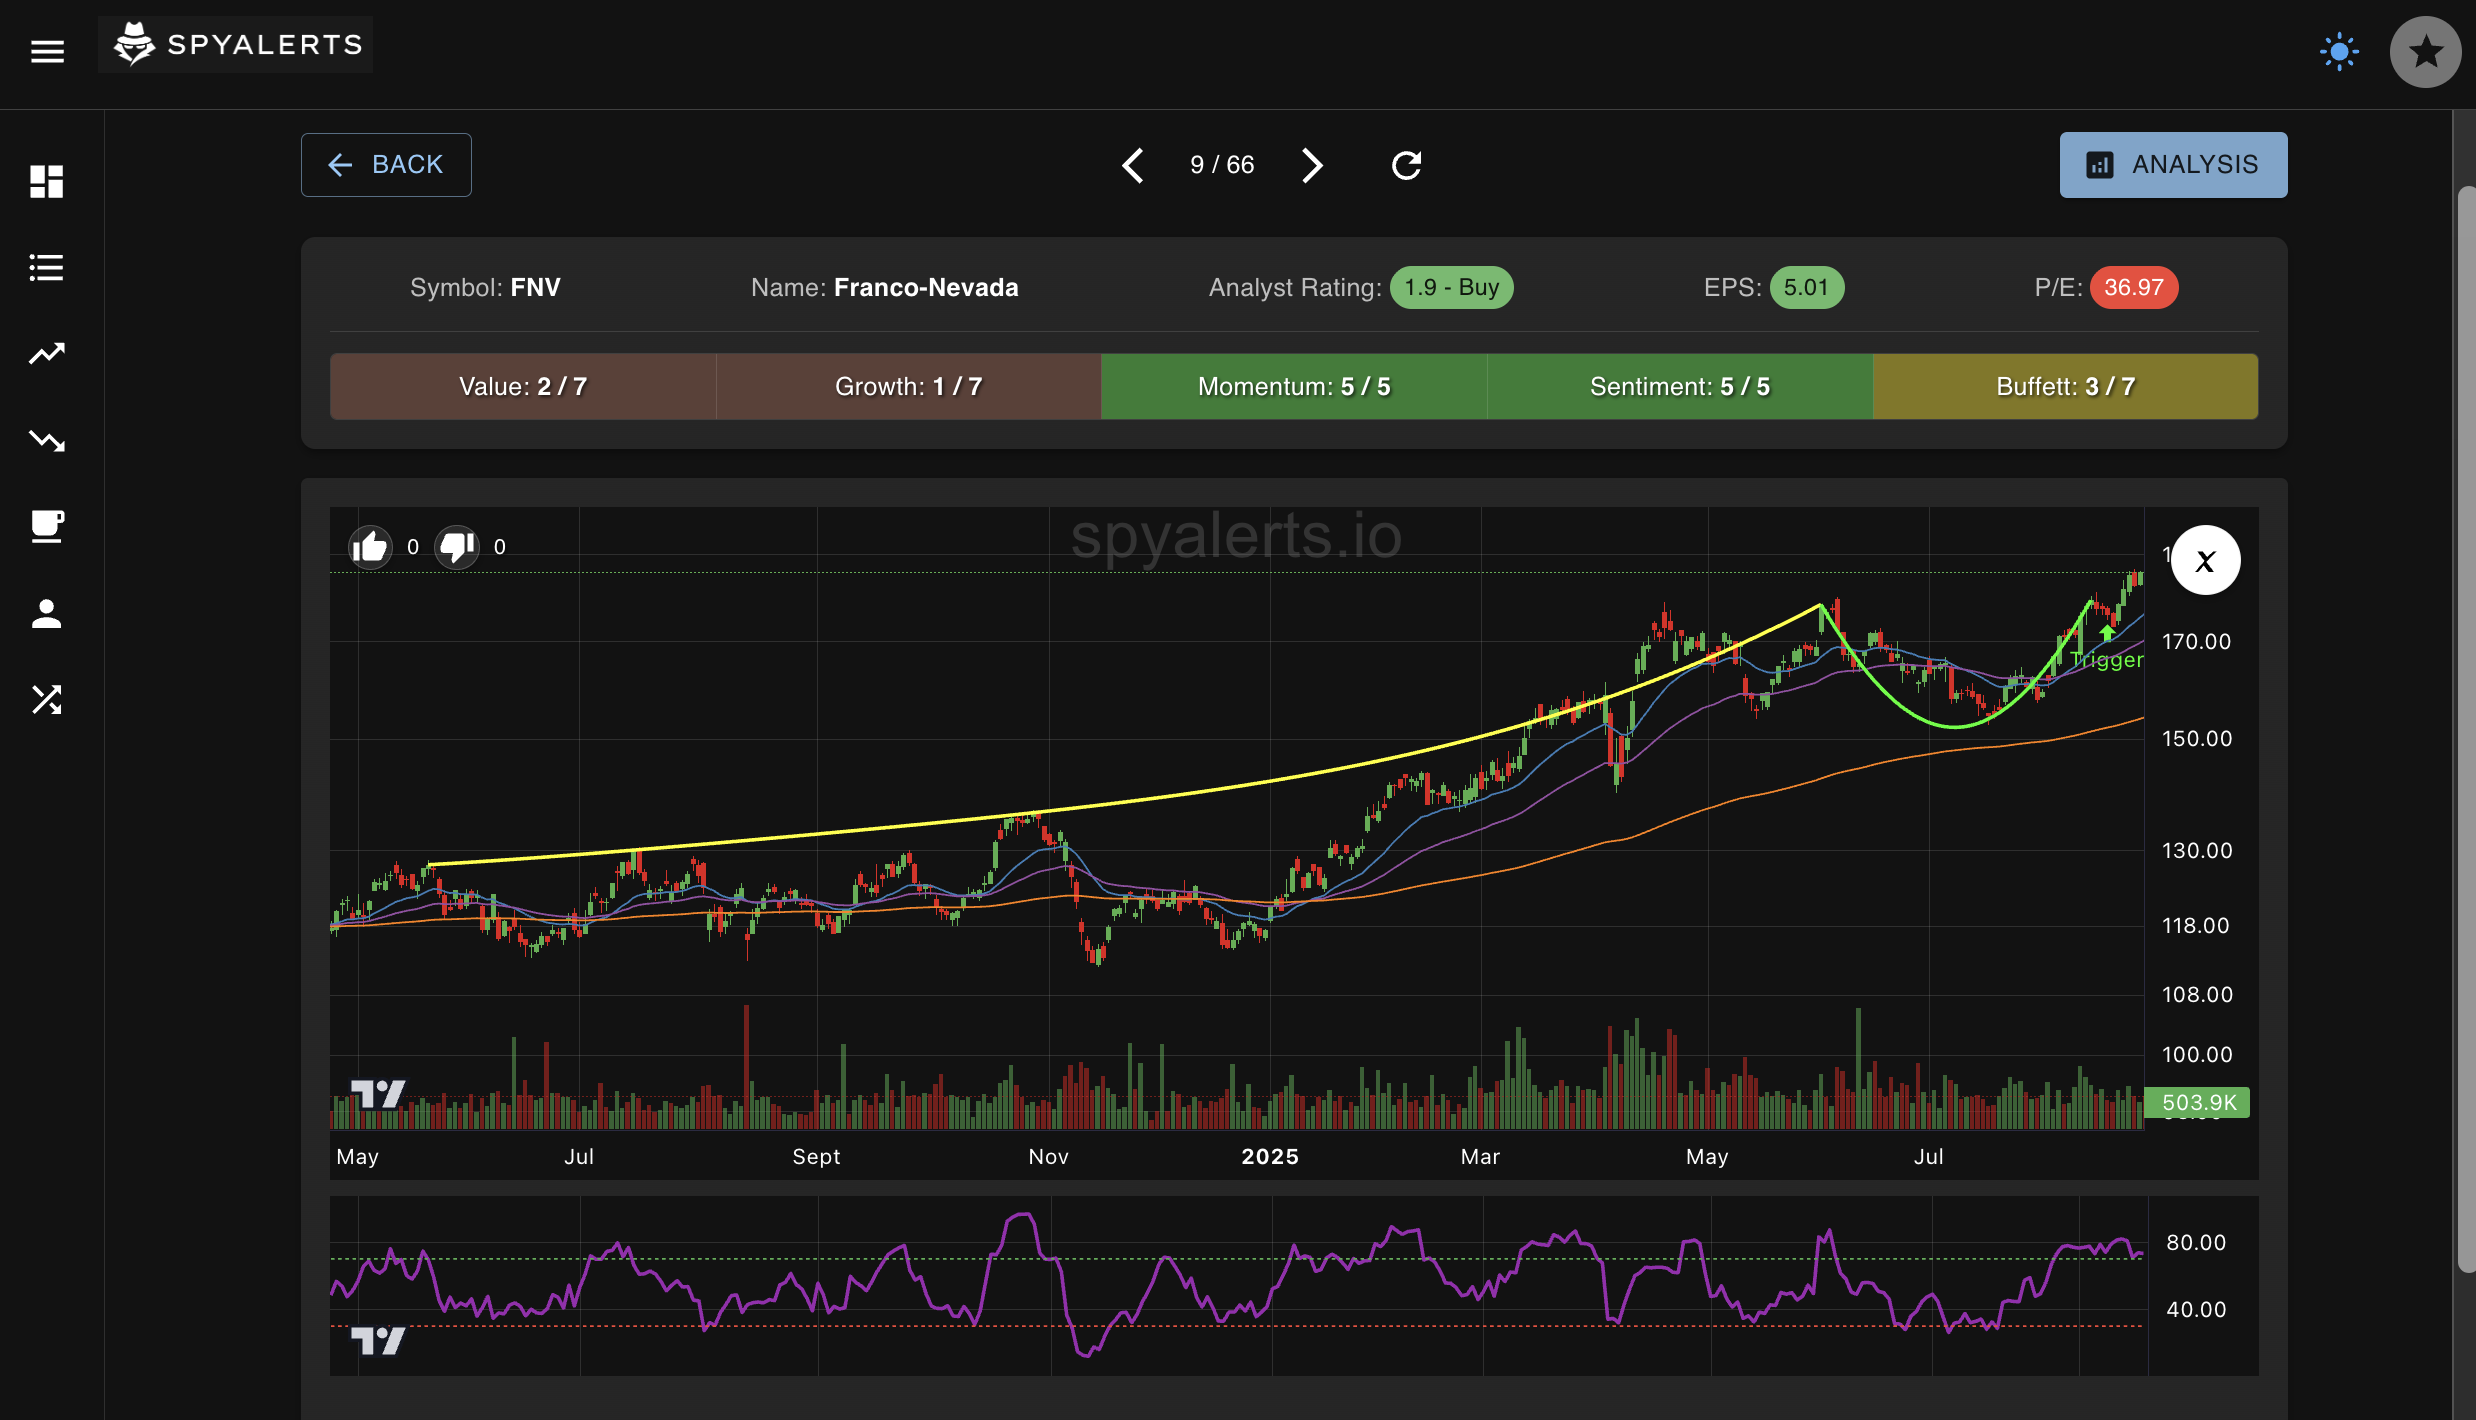
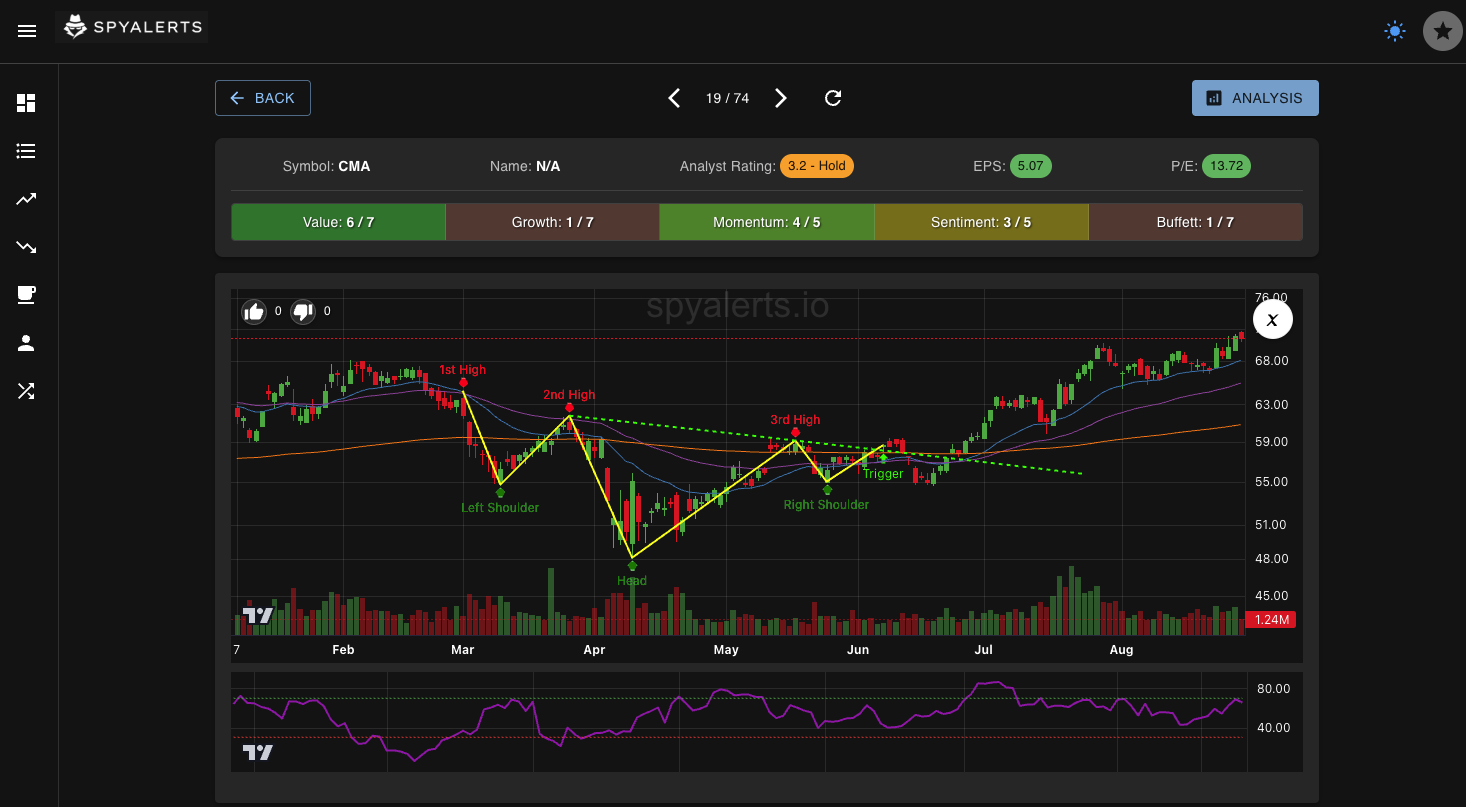
How to trade: Use our filters to identify stocks meeting your criteria, then apply additional pattern recognition to confirm entry points. This two-step process dramatically increases your win rate while reducing false signals.

Stock Filters Dashboard
VWAP Trading Analysis

VWAP Trading Strategy

Master institutional-level trading with our VWAP (Volume Weighted Average Price) analysis. Our system identifies when stocks gain the VWAP level.

We scan for stocks that have successfully gained the VWAP level with strong volume confirmation. After the initial move above VWAP, we wait for pullbacks for an optimal entry point.

How to trade: Enter long positions when price pulls back to the VWAP level after gaining it. Use the VWAP as dynamic support and set stop losses below it. Target previous highs or resistance levels for profit taking.

Downtrend Breakouts

Profit from trend reversals with our advanced downtrend breakout detection system. Our AI identifies when a stock breaks out of a sustained downtrend.

Every week, we scan for stocks that have been in clear downtrends and then show signs of breaking out with strong volume. After the breakout, we wait for a pullback to provide optimal entry points.

How to trade: Enter long positions on the pullback when price retests the breakout level. Set stop losses below the breakout point and target previous resistance levels for profit taking.

Downtrend Breakout Analysis
Cup and Handle Pattern

Cup and Handle

Unlock explosive breakout opportunities with our cup and handle pattern recognition. This powerful continuation pattern often leads to significant price moves as it represents a period of consolidation before a major breakout.

How to trade: Enter long positions when price breaks above the handle's resistance level with above-average volume. Set your stop loss below the handle's low and target 1:1 and 2:1 risk-reward ratios.

Bullish Divergence

Spot reversal opportunities before they're obvious with our advanced divergence detection. Bullish divergence occurs when price makes lower lows while technical indicators show higher lows, signaling potential trend reversals that most traders miss.

Our system scans daily charts on a weekly basis to identify the strongest divergence signals. This early warning system gives you a significant advantage, enter before the crowd recognizes the pattern.

How to trade: Enter long positions when divergence. Set stop losses below the recent swing low and target previous resistance levels.

Bull Divergence Pattern
Inverse Head and Shoulders Pattern

Inverse Head and Shoulders

Capture powerful bullish reversals with our inverse head and shoulders pattern detection. This classic reversal pattern signals the end of a downtrend and the beginning of a new uptrend.

How to trade: Enter long positions when price breaks above the neckline resistance with strong volume confirmation. Set your stop loss below the right shoulder low and target 1:1 and 2:1 risk-reward ratios.